
Skip to content
FM360AI
Menu

Reports and dashboards

Start the day knowing what needs attention first

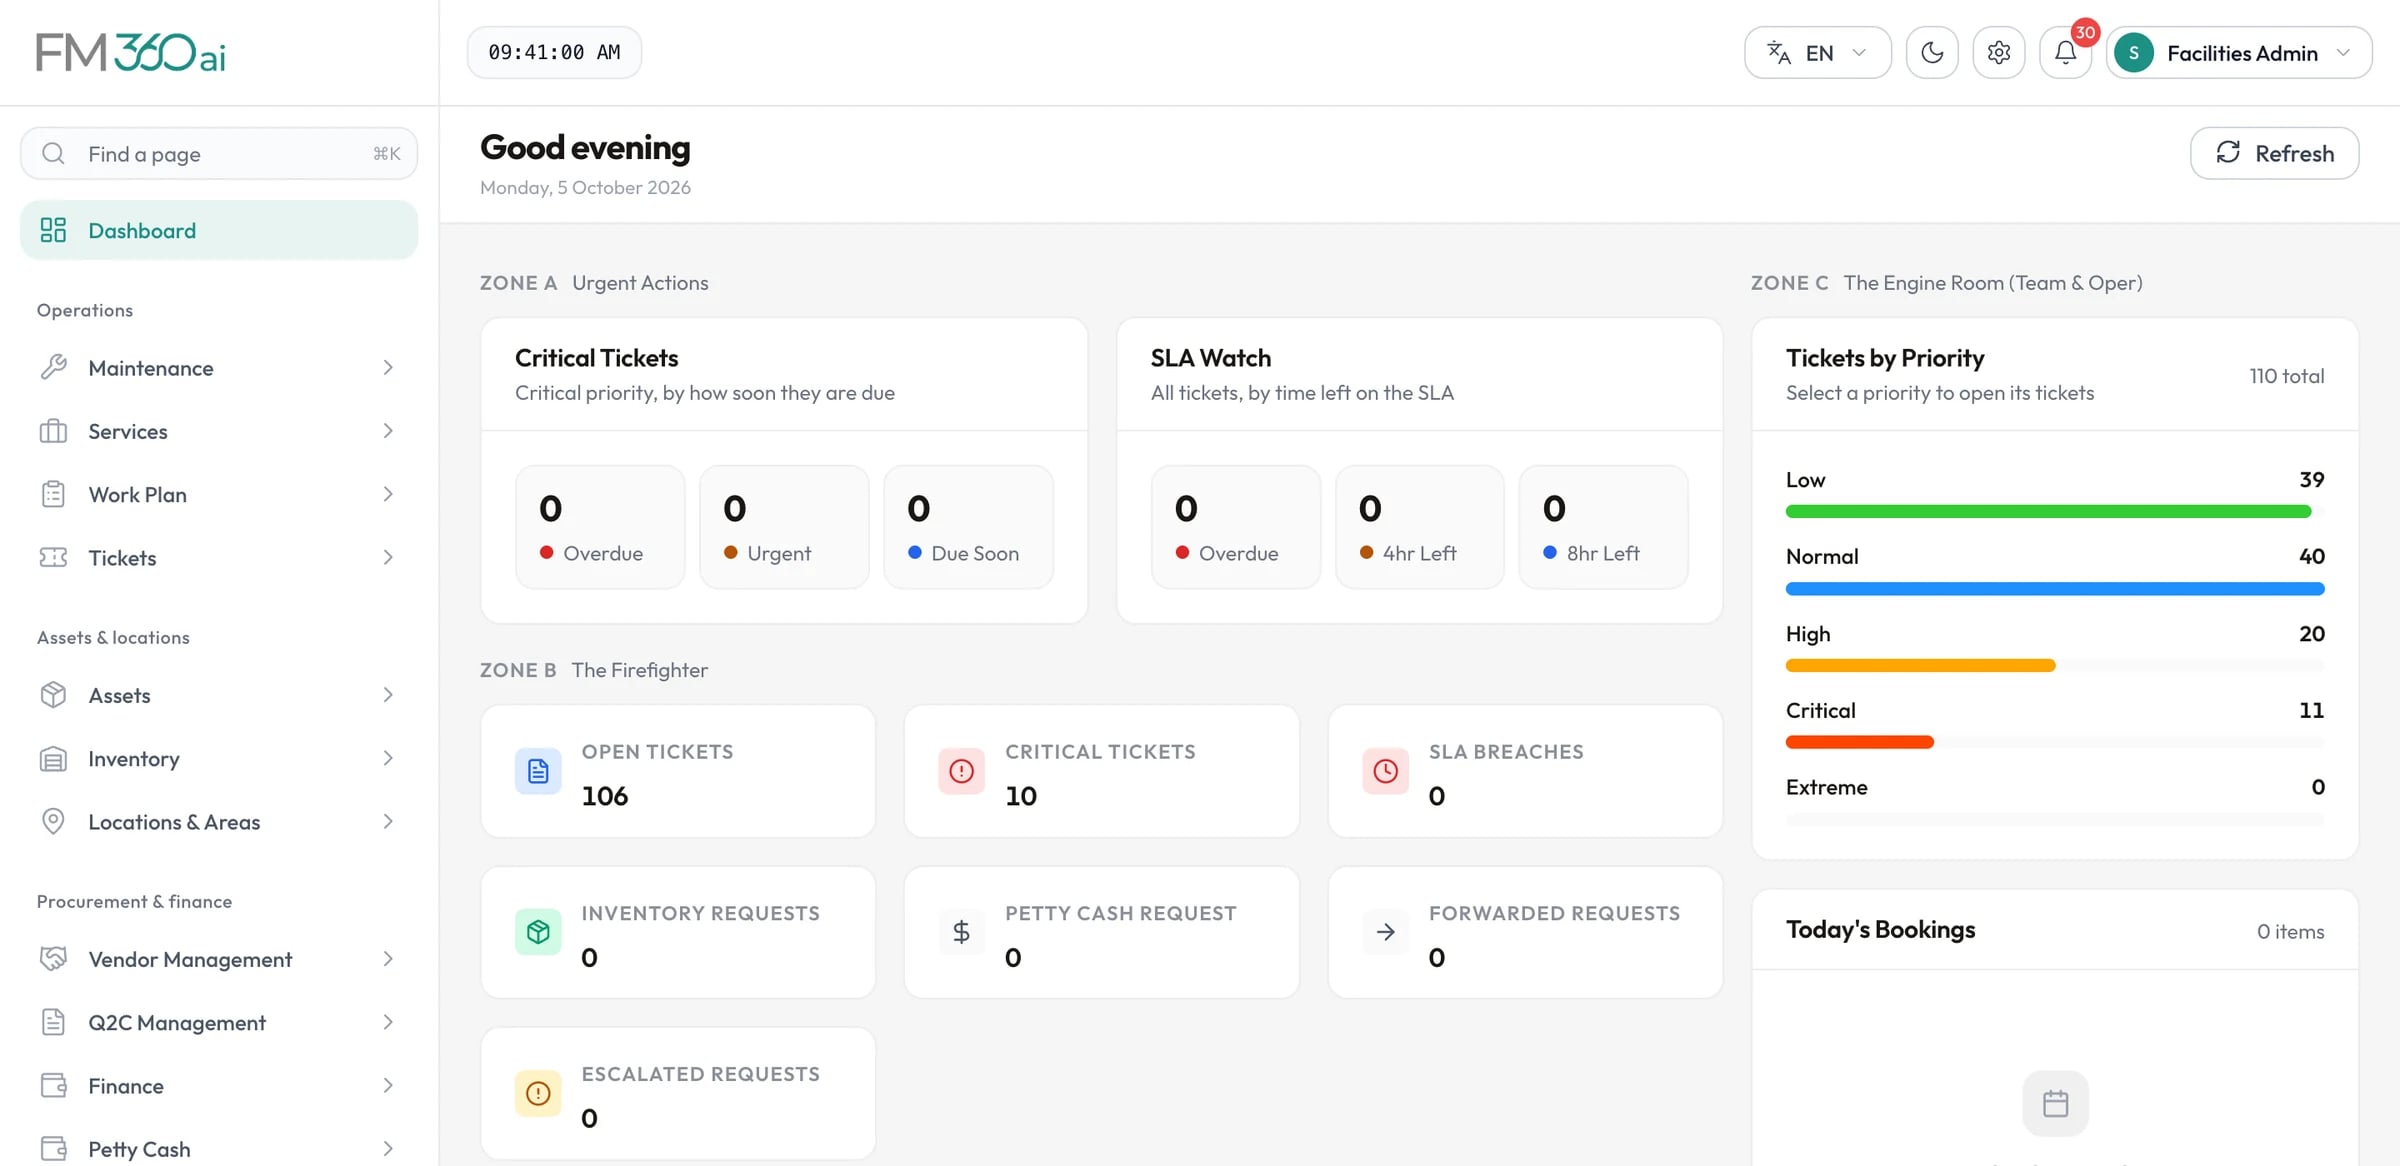
The FM360AI dashboard opens on what is urgent: critical tickets by how soon they are due and every ticket by time left on its SLA. Behind it sit reports for tickets, work plans, assets, inventory, vendors and budgets.

FM360AI dashboard showing critical tickets, an SLA watch, open ticket and request counts, and tickets by priority

Swipe the screenshot to see all of it.

Screens are from an FM360AI demo environment. Names and contact details have been replaced.

The problem

Reports assembled by hand describe last month

If answering a simple question means exporting three lists and building a pivot table, the question is usually not asked.

  • Nobody knows which tickets are about to breach until they have.
  • Workload is judged by who complains loudest.
  • Monthly reports take days and are out of date on arrival.

What FM360AI does

Reports and dashboards, in detail

Assets, inventory and maintenance

Asset history, performance, lifecycle, utilisation and transfer analytics; low stock alerts and inventory analytics; maintenance and service analytics; and work plan overview, backlog and ticket integration reports.
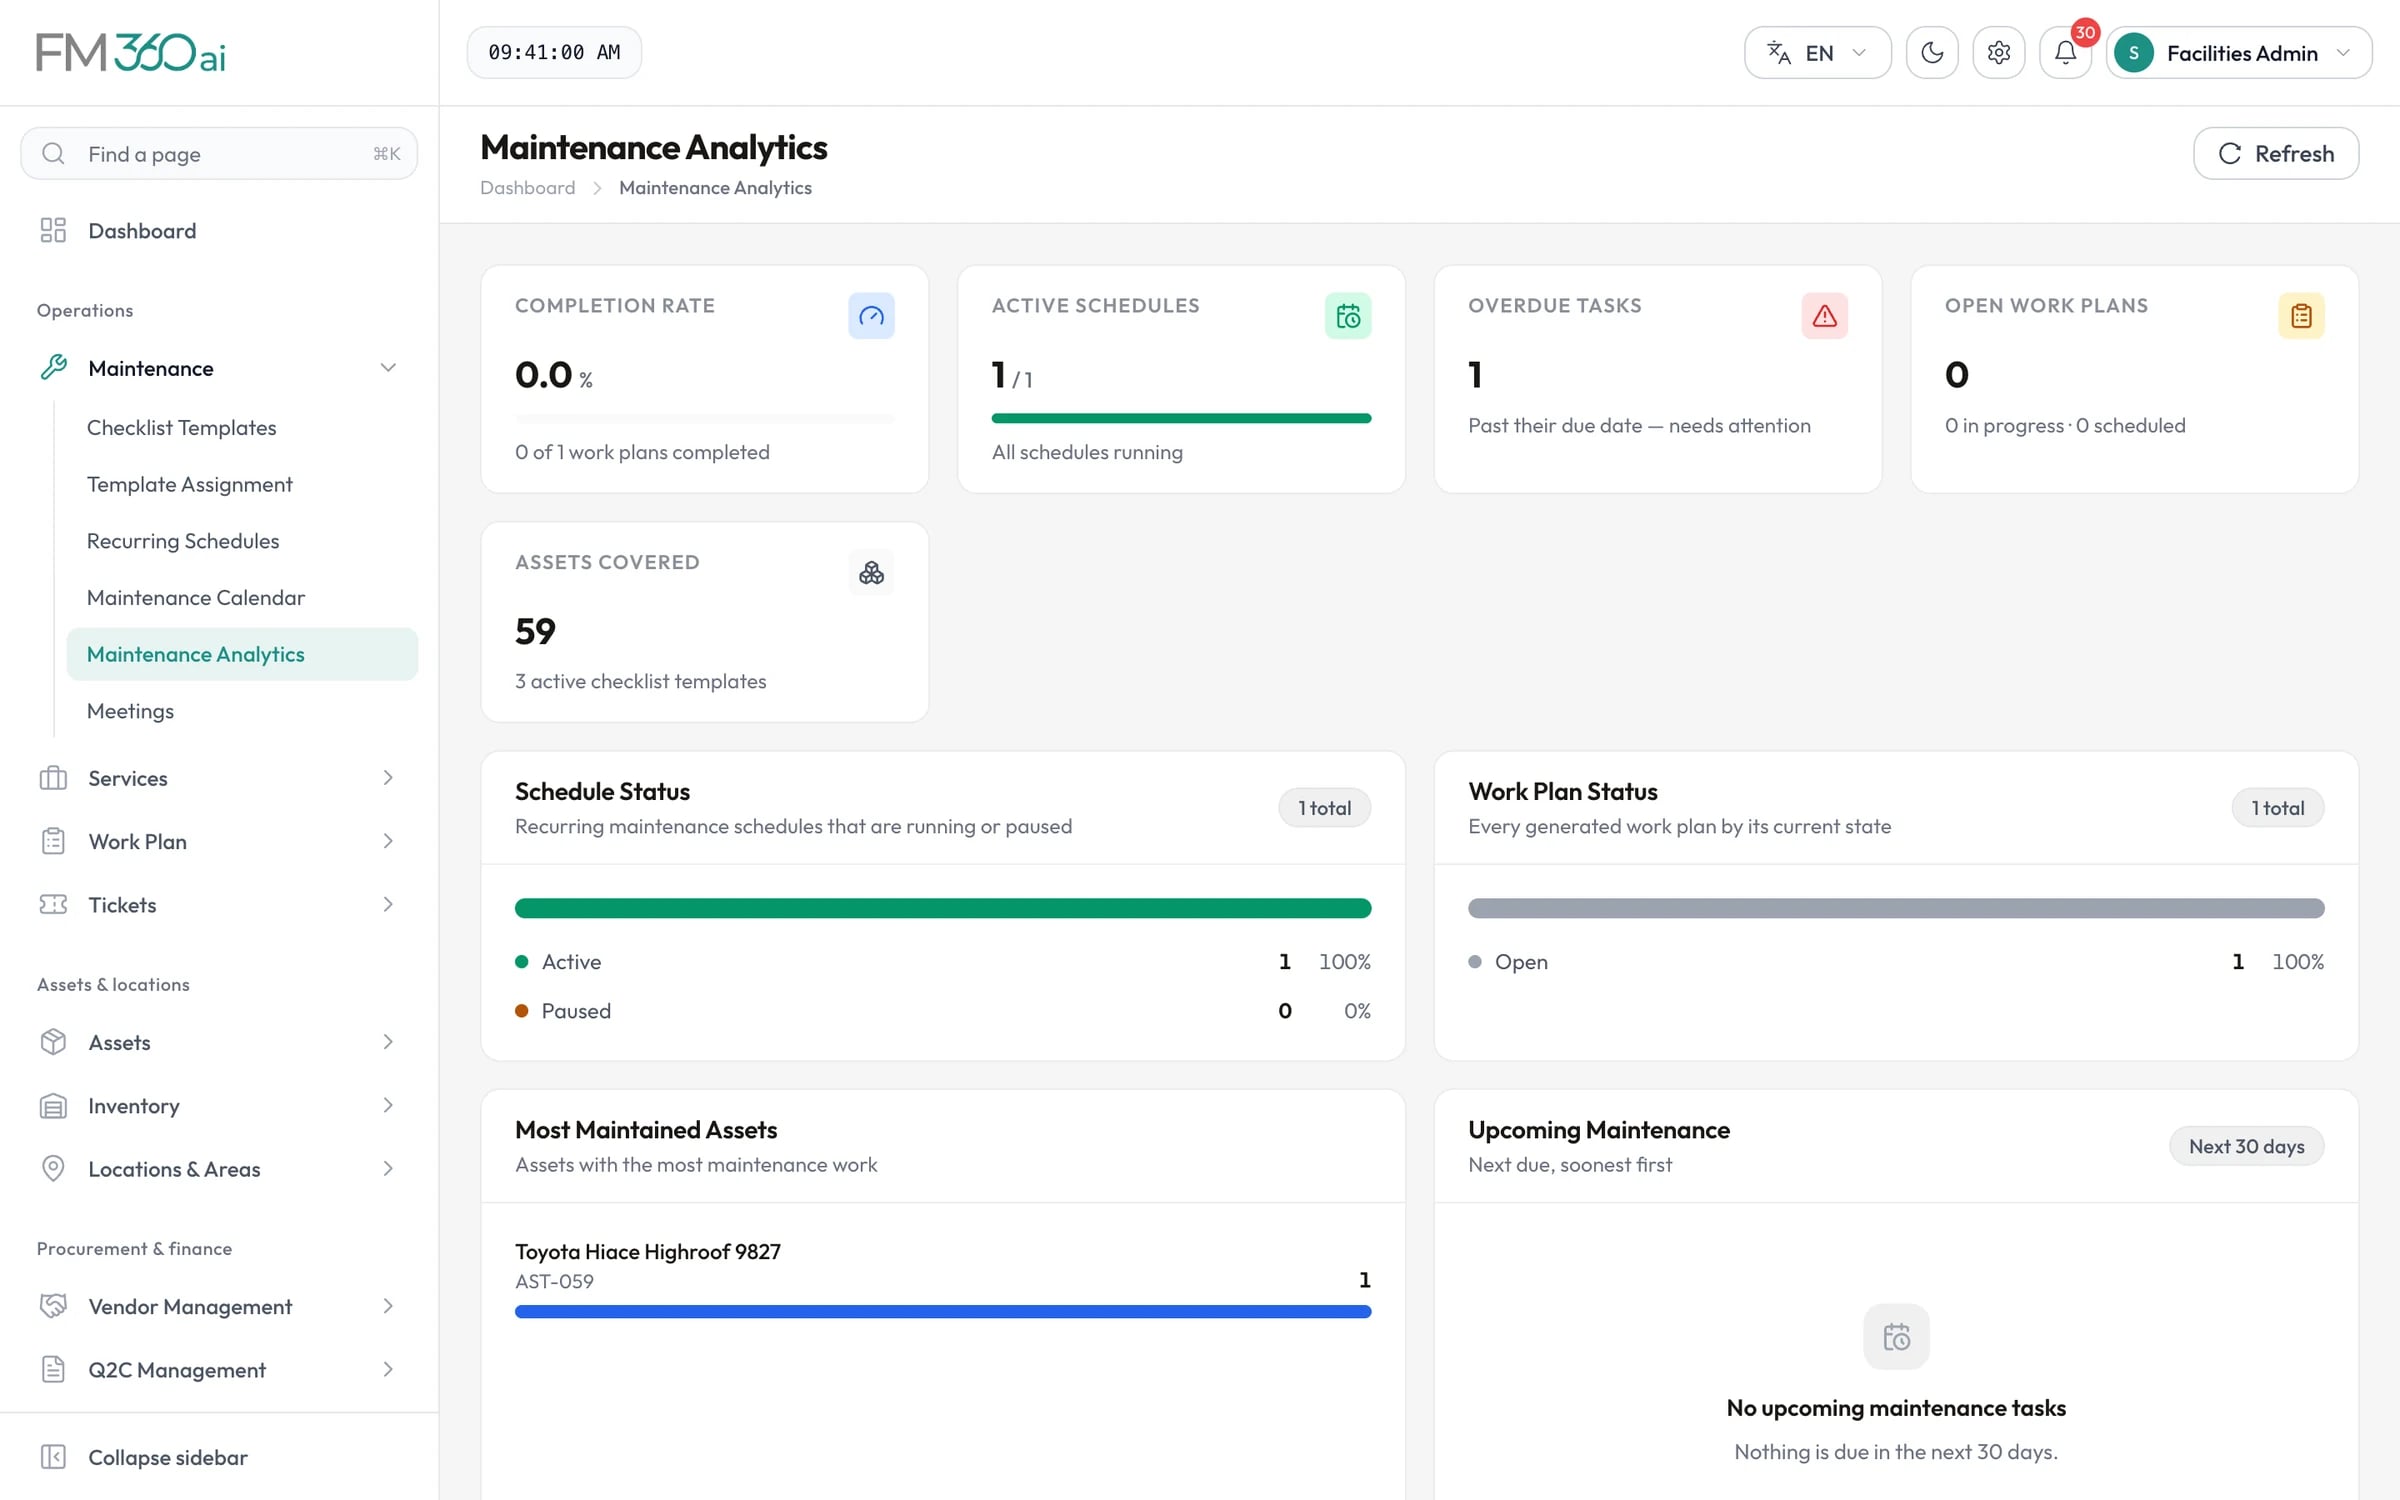
Maintenance analytics with completion rate, active schedules, overdue tasks, assets covered and most maintained assets

Swipe the screenshot to see all of it.
Vendors and money

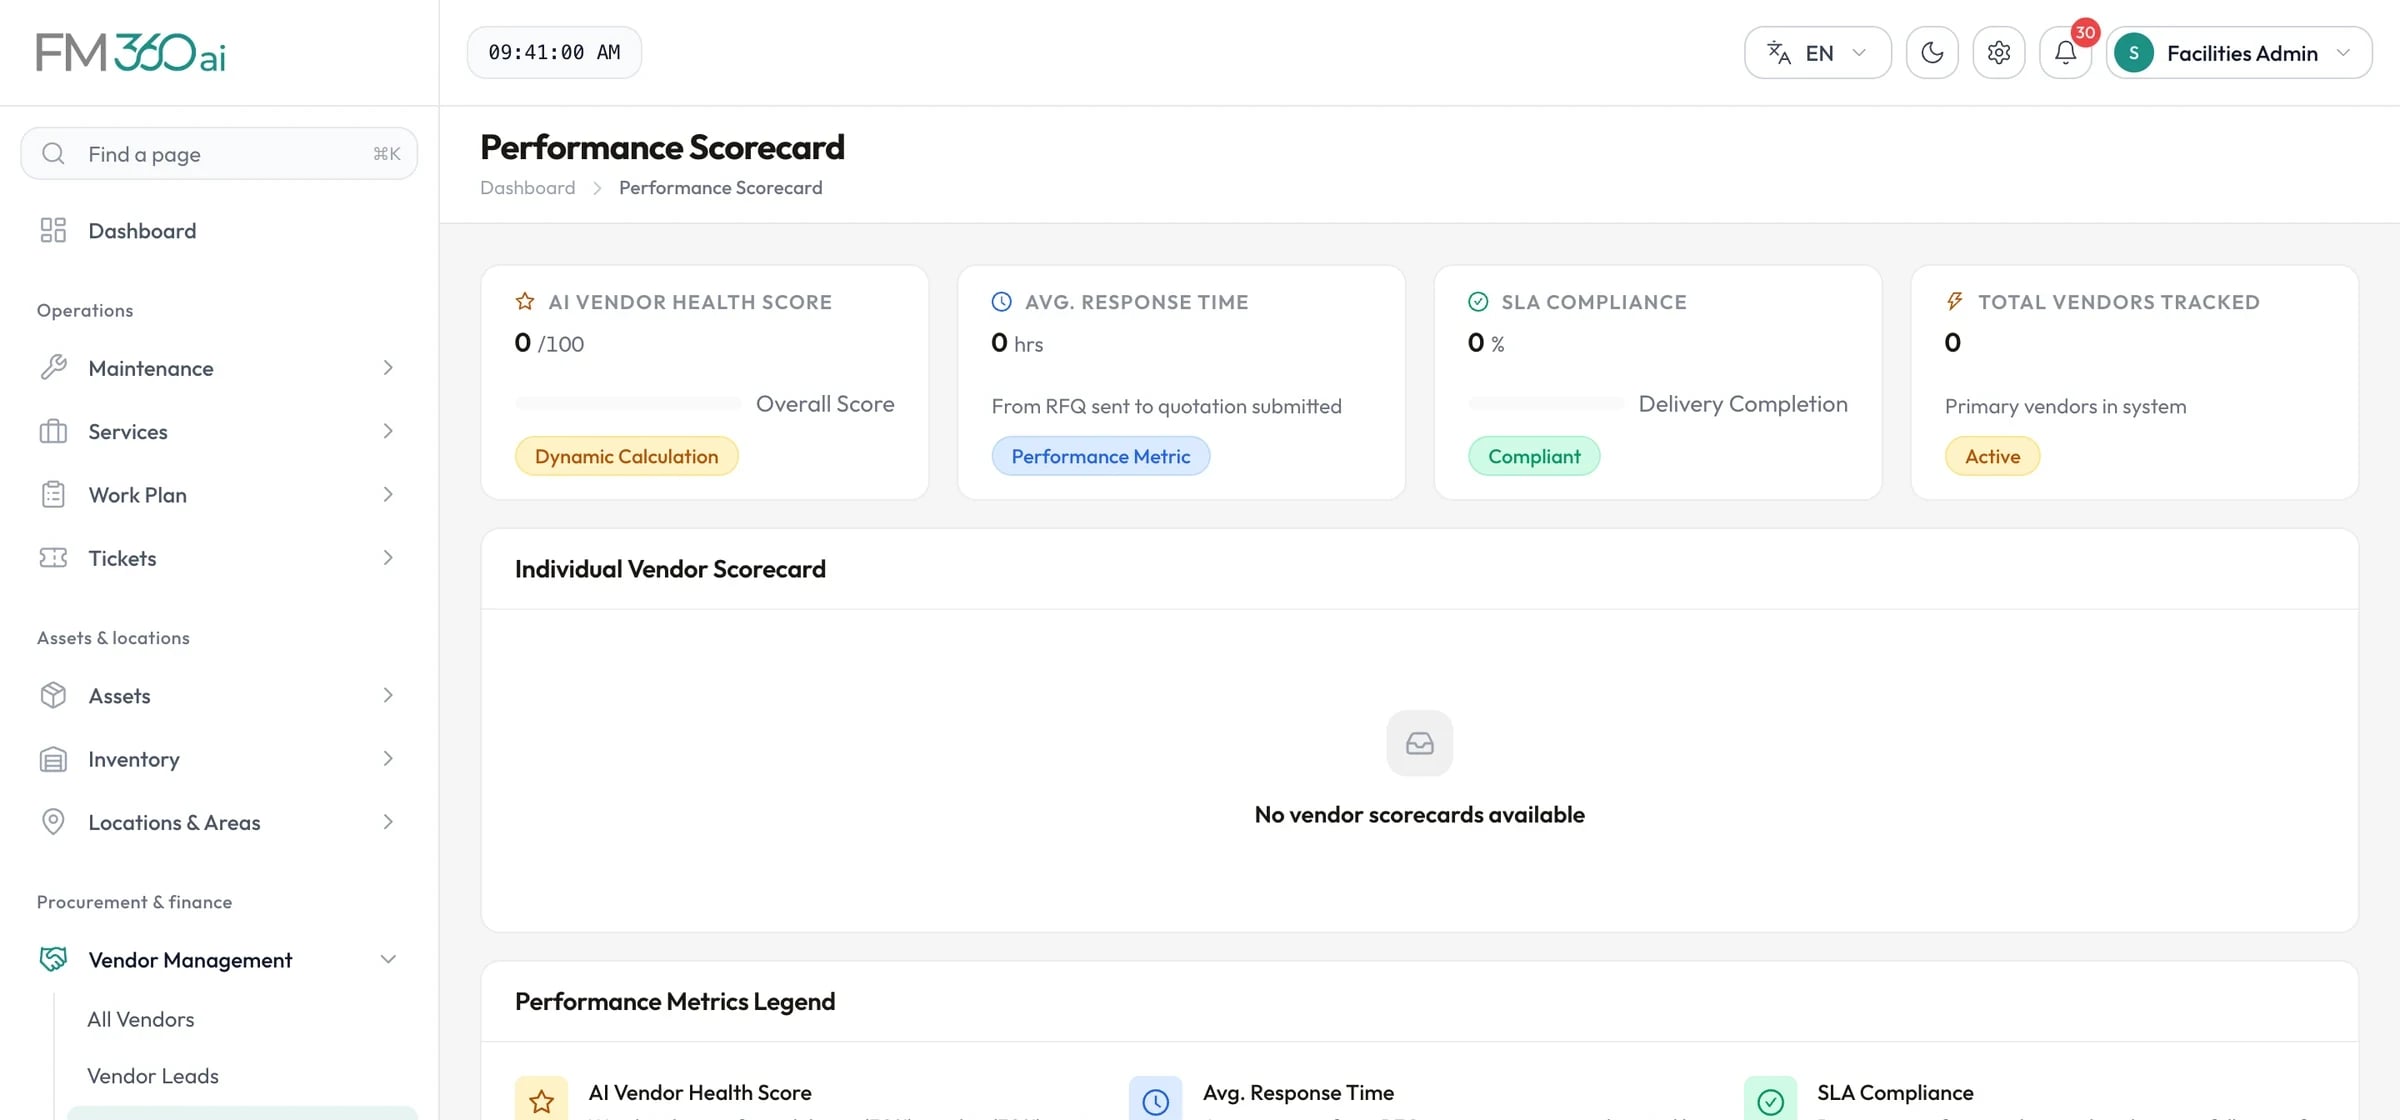
Vendor performance dashboards and scorecards, budget utilisation, cost analysis, building-wise expense, budget analytics and petty cash reports.

Vendor performance scorecard with health score, average response time, SLA compliance and a legend of how each metric is calculated

Swipe the screenshot to see all of it.

A dashboard ordered by urgency

The dashboard is laid out in zones. Urgent actions come first: critical tickets that are overdue, urgent or due soon, and an SLA watch. Then the live counts of open tickets, SLA breaches and pending requests, then team workload and bookings, then closure trends, expenses, work plans and vendors.

Every tile opens the list behind it

Click a number and you are looking at the tickets or requests it counts, already filtered. Which zones a person sees is set by their role's permissions.

Ticket and SLA reports

Ticket performance, SLA compliance, SLA and response time, agent performance, assignment and workload, and escalation and forwarded request reports.

  • Resolution rate and average resolution time
  • Compliance by priority and by agent
  • Workload across the team

Export to Excel and PDF

Most reports export to Excel, PDF or both, so the figures can go into the pack your management already reads.

How it works

How the numbers are used

  1. Step 1

    Morning

    Open the dashboard and deal with what is overdue or about to be.

  2. Step 2

    During the day

    Watch team load and reassign before someone is swamped.

  3. Step 3

    Weekly

    Review SLA compliance and the backlog by priority.

  4. Step 4

    Monthly

    Export performance, budget and vendor reports for management.

Who uses it

FM managers
One screen that says where to look first.
Operations heads
Cross-module numbers without asking for a report.
Supervisors
Their own team's workload and performance.
FM360AI for in-house facilities teams

Good to know

The scope and limits of this part of the product, so there are no surprises later.

  • Reports are run on demand. There are no scheduled or emailed reports.
  • There is no custom report builder; the reports are the ones provided.
  • Reliability measures such as MTTR and MTBF are not calculated.

Questions about reports and dashboards

Can each role see a different dashboard?

Yes. Dashboard zones are controlled by permissions, so a supervisor can be shown the operational zones while an operations head also sees finance and vendor snapshots. The mobile app has a separate dashboard for each management role.

Which reports can be exported?

Ticket performance, SLA compliance, agent performance, budget utilisation, cost analysis, work plan reports, low stock alerts, inventory analytics, asset history, performance, lifecycle, utilisation and transfer analytics, budget analytics and petty cash reports export to Excel, PDF or both.

Can we build our own reports?

Not inside the product today. The reports are fixed, with filters, and most can be exported to Excel if you want to analyse the data further.

Is the dashboard live?

The dashboard reads current data each time it loads and has a refresh button. Every tile links to the filtered list behind the number.

See FM360AI with your own buildings in mind

Tell us how requests reach your team today and what you maintain. We will walk you through the product on a call, using the workflows that matter to you.

  • A walkthrough of the real product, not slides
  • Time for your questions about fit and limits
  • No obligation to continue